Applying Multiple Operations
Multiple Operations in Columns or Rows
The Data - Multiple Operations command provides a planning tool for "what if" questions. In your spreadsheet, you enter a formula to calculate a result from values that are stored in other cells. Then, you set up a cell range in which you enter some fixed values, and the Multiple Operations command will calculate the results depending on the formula.
In the Formulae field, enter the cell reference to the formula that applies to the data range. In the Column input cell/Row input cell field, enter the cell reference to the corresponding cell that is part of the formula. This can be explained best by examples:
Examples
You produce toys which you sell for £10 each. Each toy costs £2 to make, in addition to which you have fixed costs of £10,000 per year. How much profit will you make in a year if you sell a particular number of toys?

Calculating With One Formula and One Variable
-
To calculate the profit, first enter any number as the quantity (items sold) - in this example 2000. The profit is found from the formula Profit = Quantity * (Selling price - Direct costs) - Fixed costs. Enter this formula in B5.
-
In column D enter a number of annual sales values, one below the other; for example, in steps of 500 from 500 to 5000.
-
Select the range D2:E11, i.e. the values in column D and the empty cells alongside in column E.
-
Choose Data - Multiple operations.
-
With the cursor in the Formulae field, click cell B5.
-
Set the cursor in the Column input cell field and click cell B4. This means that B4, the quantity, is the variable in the formula, which is replaced by the selected column values.
-
Close the dialogue box with OK. You will see the profits for the different quantities in column E.
Calculating with Several Formulae Simultaneously
-
Delete column E.
-
Enter the following formula in C5: = B5 / B4. You are now calculating the annual profit per item sold.
-
Select the range D2:F11, thus three columns.
-
Choose Data - Multiple Operations.
-
With the cursor in the Formulae field, select cells B5 thru C5.
-
Set the cursor in the Column input cell field and click cell B4.
-
Close the dialogue box with OK. You will now see the profits in column E and the annual profit per item in column F.
Multiple Operations Across Rows and Columns
Office allows you to carry out joint multiple operations for columns and rows in so-called cross-tables. The formula cell must refer to both the data range arranged in rows and the one arranged in columns. Select the range defined by both data ranges and call the multiple operation dialogue box. Enter the reference to the formula in the Formulae field. The Row input cell field is used to enter the reference to the first cell of the range arranged in rows, and the Column input cell field the first cell of the range arranged in columns.
Calculating with Two Variables
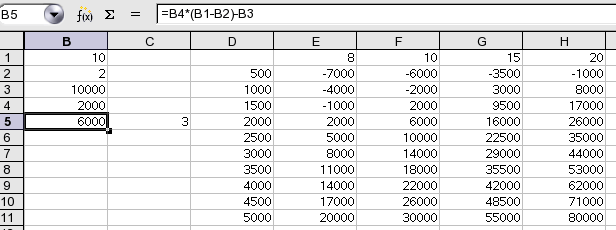
Consider columns A and B of the sample table above. You now want to vary not just the quantity produced annually, but also the selling price, and you are interested in the profit in each case.
Expand the table shown above. D2 thru D11 contain the numbers 500, 1000 and so on, up to 5000. In E1 through H1 enter the numbers 8, 10, 15 and 20.
-
Select the range D1:H11.
-
Choose Data - Multiple Operations.
-
With the cursor in the Formulae field, click cell B5.
-
Set the cursor in the Row input cell field and click cell B1. This means that B1, the selling price, is the horizontally entered variable (with the values 8, 10, 15 and 20).
-
Set the cursor in the Column input cell field and click in B4. This means that B4, the quantity, is the vertically entered variable.
-
Close the dialogue box with OK. You will see the profits for the different selling prices in the range E2:H11.